01The problem问题
LFP cells fade almost linearly for a long time, then bend sharply downward. That bend, the knee, is what sets warranty risk, and it cannot be seen in early data by eye. On the supplier's previous cell generation, extrapolating the linear phase had over-predicted life by 35–60 %.
LFP 电芯在很长一段时间内几乎线性衰减,随后突然加速下滑。这个转折点——拐点——决定了质保风险,而在早期数据中肉眼无法看出。对该供应商上一代电芯,用线性段外推曾把寿命高估了 35–60 %。
02What we did我们做了什么
Split the data honestly严格划分数据
96 cells across six conditions (25 / 35 / 45 °C × 0.5C / 1C, 100 % DoD). 64 cells for calibration, 32 held out, split by cell and stratified by condition, so no held-out cell shares data with training.
96 颗电芯覆盖六种工况(25 / 35 / 45 °C × 0.5C / 1C,100 % DoD)。64 颗用于标定,32 颗留出;按电芯划分并按工况分层,留出电芯的数据完全不进入训练。
Separate the degradation modes拆分衰减模式
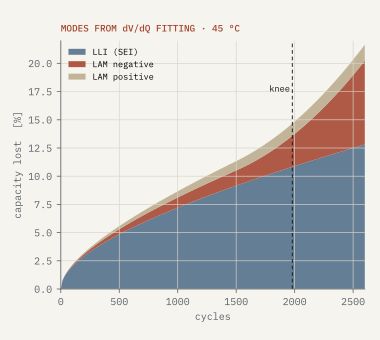
At each reference performance test we fitted dV/dQ curves to separate loss of lithium inventory (LLI) from loss of active material on each electrode (LAM).
在每次 RPT 中拟合 dV/dQ 曲线,把活性锂损失(LLI)与正、负极活性材料损失(LAM)分开。
Model the mechanism behind the knee对拐点背后的机理建模
SEI growth drives LLI; temperature- and rate-dependent LAM erodes the graphite's capacity margin. When the anode no longer has room for the lithium inventory, plating begins and fade accelerates. Bayesian calibration gives each cell its own uncertainty band.
SEI 生长导致 LLI;与温度、倍率相关的负极 LAM 不断侵蚀石墨的容量余量。一旦负极容纳不下可用锂,便开始析锂,衰减随之加速。贝叶斯标定为每颗电芯给出各自的不确定度区间。
Predict from early data only只用早期数据预测
For each held-out cell the model saw only the first 300 cycles and three RPTs, then predicted the knee onset and the full fade curve.
对每颗留出电芯,模型只使用前 300 次循环与三次 RPT,预测拐点位置与完整衰减曲线。
03Results结果
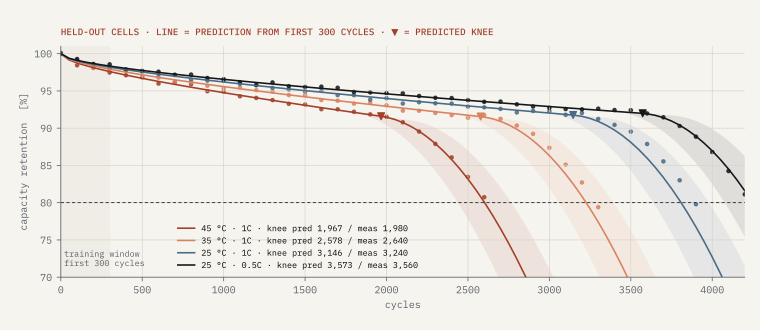
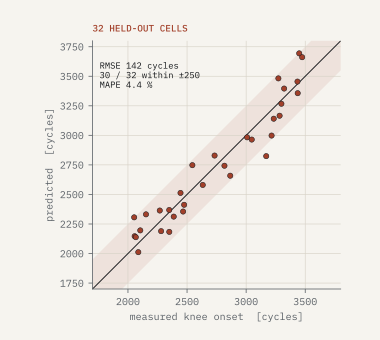
- Knee onset RMSE of 142 cycles on 32 held-out cells whose knees fell between 1,900 and 3,600 cycles. 30 of 32 predictions were within ±250 cycles.
- 拐点预测 RMSE 为 142 次循环,32 颗留出电芯的拐点分布在 1,900–3,600 次之间;32 颗中有 30 颗误差在 ±250 次以内。
- The mechanism changed the operating advice. Anode LAM at high temperature drives the knee. Lowering the container set-point from 35 °C to 30 °C in hot-climate sites is projected to add 18 % more cycles before the knee.
- 机理结论改变了运行建议。高温下的负极 LAM 是拐点的主因。将炎热地区储能柜的温控设定从 35 °C 降至 30 °C,预计拐点前可多出 18 % 的循环次数。
- A knee-based acceptance test. The supply contract now includes a 300-cycle screening test with the model's P10 prediction as the pass criterion.
- 以拐点为依据的验收测试。供货合同中加入了 300 次循环的筛选测试,以模型的 P10 预测值作为合格判据。
04Limits of validity适用边界
LFP | graphite cells from this supplier, 25–45 °C, 0.5–1C, 100 % DoD. Partial-DoD cycling and calendar ageing at rest are estimated but not yet validated: only nine months of calendar data existed at handover. The pipeline re-runs as new RPT data arrive.
适用于该供应商的 LFP | 石墨电芯,25–45 °C、0.5–1C、100 % DoD。部分放电深度循环与静置日历老化目前为估算值、尚未验证——交付时日历老化数据仅有九个月。新的 RPT 数据到达后流水线会自动重新计算。